
Studies
Ashland - I-95/Route 54 Interstate Access Report Study
Study Details
- Existing capacity and safety issues at the I-95 at Route 54 Partial Cloverleaf interchange (between milepost 91.8 and 92.2) and concerns regarding the additional traffic that will be generated from planned developments and overall growth in the area, which will potentially cause the interchange to be overcapacity causing even more operational and safety issues. The I-95/Route 54 Interchange Improvement Screening Study, prepared for Hanover County and the Town of Ashland by Kimley Horn, November 2015, projected the interchange to operate beyond capacity by 2025.
- Existing safety and operational issues on the study section of Route 54, which may worsen with future traffic growth from planned and overall growth as well. The same study, I-95/Route 54 Interchange Improvement Screening Study, identified an injury crash rate on this section of Route 54 that was 50 percent higher than the statewide average at that time and identified several intersection movements expected to perform at LOS E or F in future (2040) conditions.

Project Study Area and Data Collection
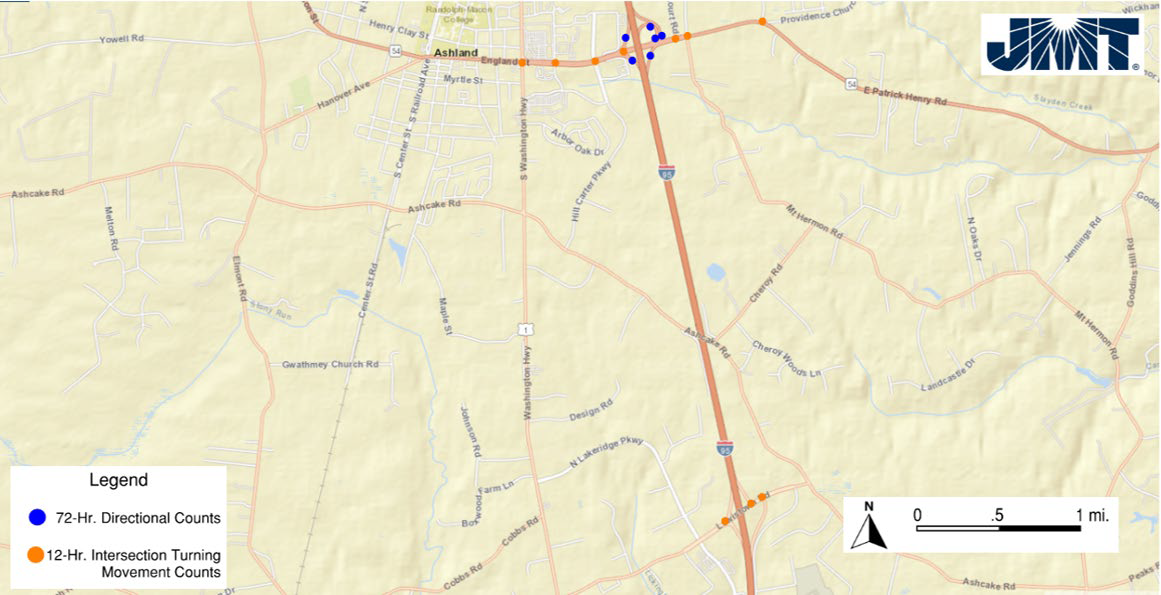
1. Route 54 at Route 1 (Washington Highway)2. Route 54 at Cottage Green Drive3. Route 54 at Hill Carter Parkway4. Route 54 at North Carter Road5. Route 54 at I-95 SB On/Off-Ramps6. Route 54 at Telcourt Road7. Route 54 at Mount Hermon Road/Frances Road8. Route 54 at Woodside Lane (no data will be collected for Providence Church Road)
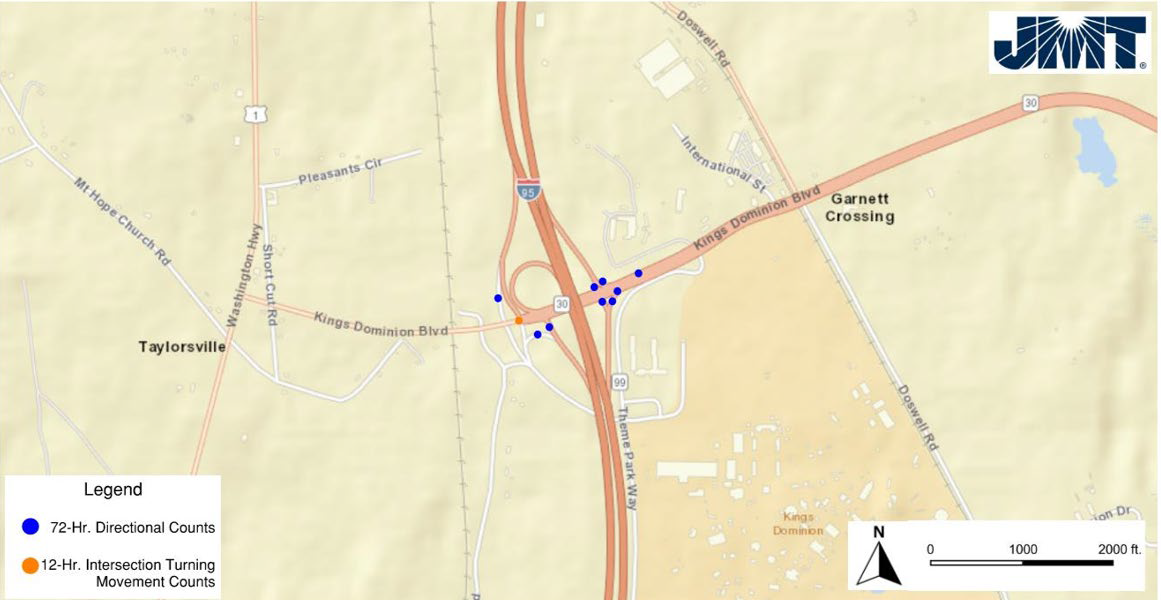
1. I-95 SB Off-Ramp at Route 30
1. Lewistown Road at I-95 SB On/Off-Ramps2. Lewistown Road at I-95 NB On-ramp3. Lewistown Road at I-95 Off-ramp/Travel Center
1. I-95 at Route 54 Interchange:
a. I-95 SB Off-ramp right-turn laneb. I-95 SB On-ramp right-turn lanec. I-95 NB Off-ramp to Route 54 EBd. I-95 NB Off-ramp loop to Route 54 WBe. Route 54 EB to I-95 NB On-rampf. Route 54 WB to I-95 NB On-ramp
2. I-95 at Route 30:
JMT will inventory existing sidewalk, crosswalk, and bus stop locations. JMT will coordinate with the local transit operator and provide existing information regarding transit ridership, stop locations, and frequency of service for the study. In addition, any planned route additions or modifications will be provided to the study team. This data will be used to guide the development of pedestrian, bicycle, and transit recommendations along the arterial roadway network.a. I-95 SB Off-ramp to Kings Dominion parkingb. On-ramp loop to I-95 SB from Route 30 WBc. I-95 SB On-ramp from Kings Dominion parkingd. I-95 SB On-ramp from Route 30 EBe. I-95 NB Off-ramp to Route 30 WBf. I-95 NB Off-ramp to Route 30 EBg. I-95 NB On-ramp from Route 30 WBh. I-95 NB On-ramp from Route 30 EBi. Route 30 EB (east of the interchange)j. Route 30 WB (east of the interchange)
Traffic Forecasting
Safety Review and Analysis
Within the study area, I-95 and Route 54 contain ranked segments of potential for safety improvements (PSI) within the Richmond District based on 2016-2020 and 2017-2021 crash databases. Additionally, Route 54 contains a PSI intersection. The PSI list identifies segments or intersections that have experienced more crashes than what is predicted for that site based on safety performance functions, and ranks those sites based on that differential. Note that PSI ranks for segments and intersections were obtained from the 2016-2020 and the 2017-2021 PSI databases, since the latter only includes VDOT maintained segments and intersections. The PSI locations will serve to help prioritize where to focus safety improvements because they have the highest potential to improve safety; however, a detailed safety analysis will be conducted within the entire study area using five-year historical crash data, downloaded from VDOT’s PowerBI crash database, to compare to the PSI rankings and identify hot spots, contributing factors, and countermeasures to address and prioritize safety needs. The historical intersection crash analysis results will be compared with the PSI ranked intersections as the PSI rank indicates a higher prioritization. Figure 4 and Figure 5 summarize the PSI segments and intersections within the study area, which include the following:
- Route 54 from US 1 to Cottage Green Drive (District Rank 126) – Source: 2016-2020 Top Potential Safety Improvements database (Figure 4)
- Route 54 from Cottage Green Drive to Carter Road (District Rank 109) – Source: 2016-2020 Top Potential Safety Improvements database (Figure 4)
- Route 54 from Telcourt Road to Providence Church Road (District Rank 663) – Source: 2016-2020 Top Potential Safety Improvements database (Figure 4)
- Route 30 from the I-95 SB off ramp to International Street (District Rank 92) – Source: PSI Top 100 2017-2021 database (Figure 5)
- US 1 at Route 54 (District Rank 175) – Source: 2016-2020 Top Potential Safety Improvements database layer (Figure 4)
- Route 54 from Route 1 to West of Woodside Lane (Statewide Top 1% Corridors)
- US 1 throughout the intersection with Route 54 (Statewide Top 1% Corridors)
- Cottage Green Drive from Route 54 to Junction Drive (District Top 1% Segments)
JMT will conduct a review of the most recent five years of available crash data, assumed to be 2018-2022. The crash review will include the development of intersection crash summaries and the identification of crash patterns. JMT will review pedestrian crashes to determine what proportion of crashes are related to pedestrians and bicyclists along Route 54. Density heat maps along I-95 will also be created to visualize the crash patterns within the study area.
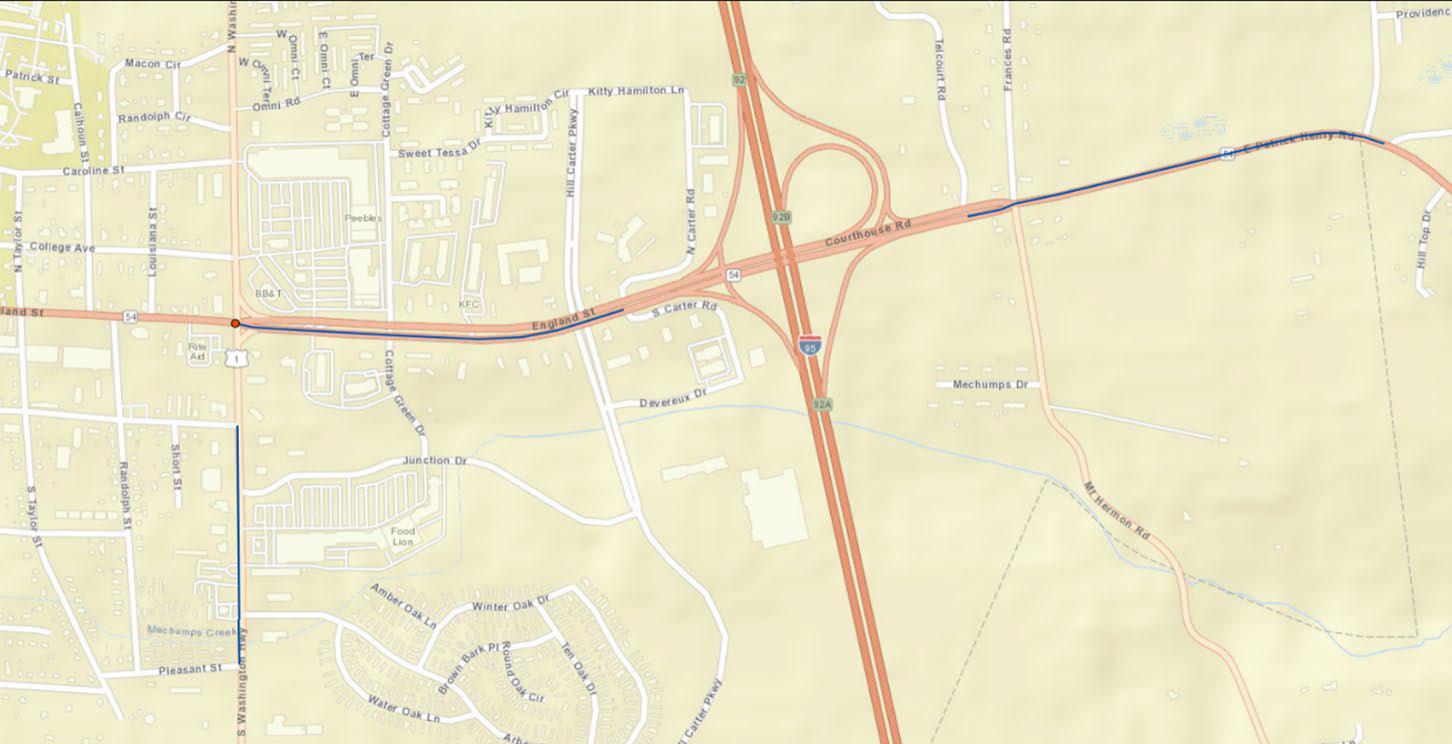
Figure 4: PSI Segments/Intersections Summary Map (2016-2020)
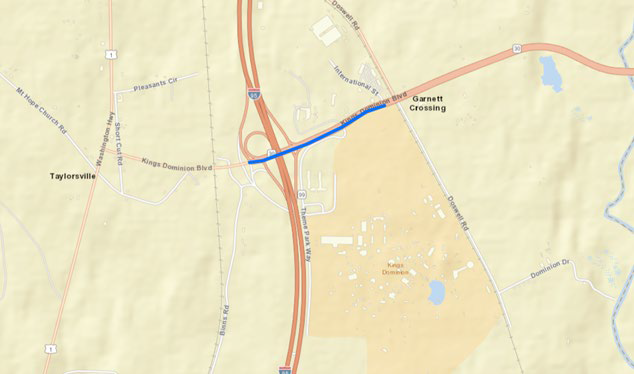
Figure 5: PSI Segments/Intersections Summary Map (2017-2021)
JMT will use available Crash Modification Factors (CMFs) to compare the safety impacts of potential improvements during the screening process to identify the projected reductions in crashes. If reliable CMFs are not available to analyze certain improvement types, JMT will use a conflict point summary or a qualitative analysis to determine the projected impact of those improvements on safety. The Highway Safety Manual (HSM) spreadsheets and ISATe (Enhanced Interchange Safety Analysis Tool) will not be used to evaluate safety conditions for this study.
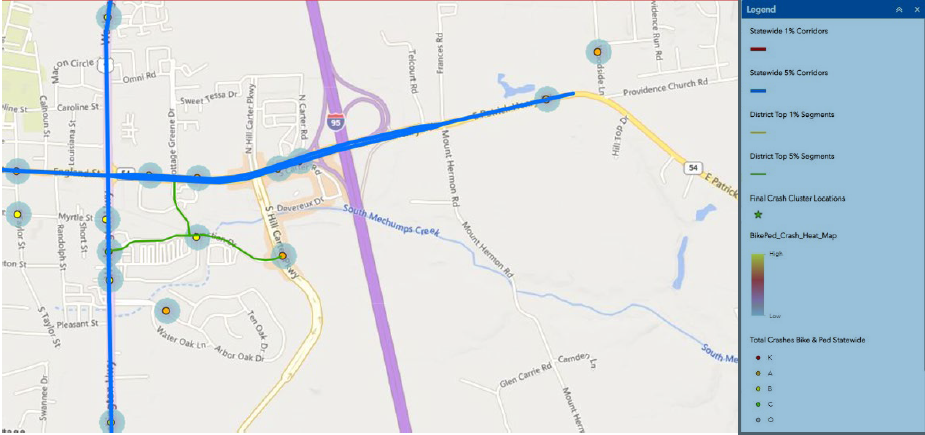
Figure 6: PSAP Segments/Intersections Summary Map
Study Schedule
| Item | Estimated Completion |
|
Data Collection |
Completed |
|
First Public Outreach |
September 2023 |
|
Existing condition memorandum and presenting to SWG |
October 2023 |
|
Travel Demand Forecasting |
October 2023 |
|
Stage 1 – iCAP Analysis and Alternative Screening |
November 2023 |
|
Stage 1 – Concept Development and Cost Estimate |
November 2023 |
|
Stage 2 – Alternative Analyses (Opening and Design Year) * |
January 2024 |
|
Second Public Outreach |
February 2024 |
|
Stage 2 – Concept and Detailed Cost Estimate for Preferred Alternative |
March 2024 |
|
Draft Report |
August 2024 |
| Final Report | December 2024 |


