Studies
Richmond - I-95/East Parham Road (Route 73) Interstate Access Report Study
Study Details
- The existing capacity and safety issues at the I-95 at Parham Road Full Cloverleaf interchange and the concerns regarding the additional traffic that will be generated from developments such as GreenCity Development, and Magellan Parkway Extension, and overall growth in the area, which will potentially cause the interchange to be overcapacity causing even more safety issues.
- The existing weaving section at the I-95 at Parham Road Full Cloverleaf interchange and to the west due to lane configurations at the intersections west of the interchange, leading to operational and safety challenges.

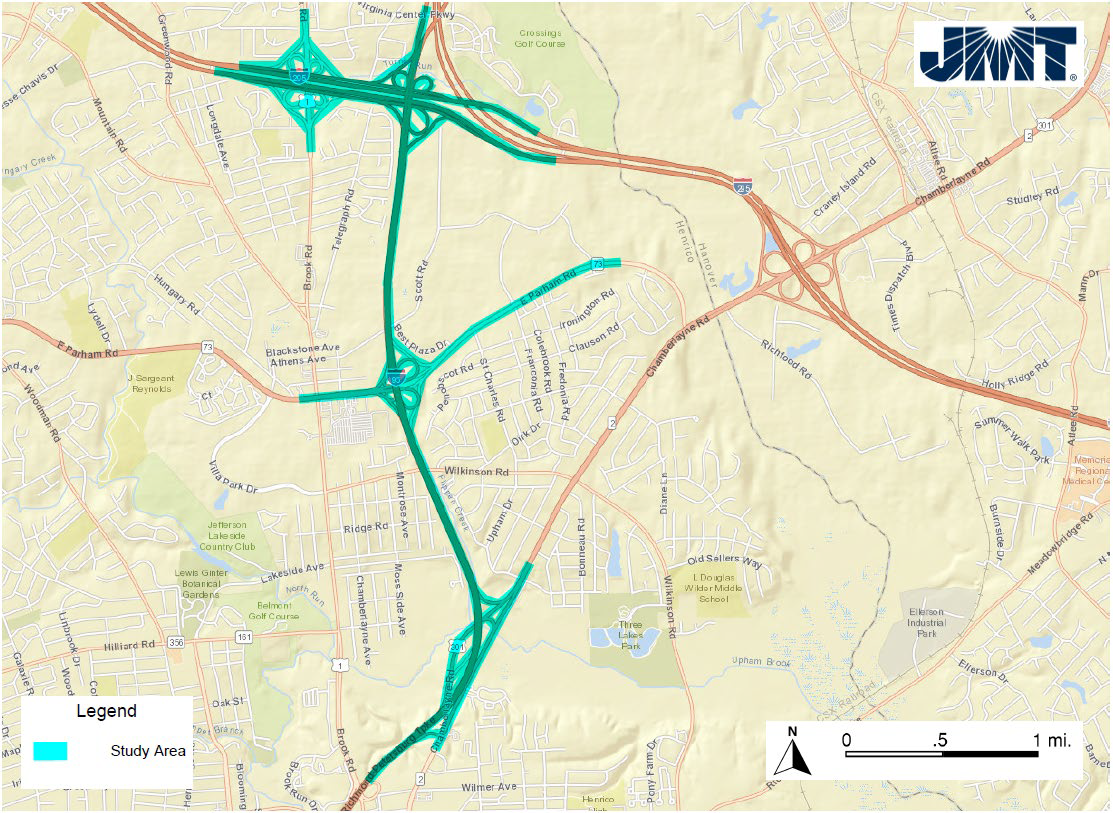
Figure 1: Study Area Map
Project Study Area and Data Collection
1. Parham Road & US Rte. 1 (Brook Rd.) - Signalized2. Parham Road & Northpark Center - Signalized3. Parham Road & St. Charles Rd. - Unsignalized4. Parham Road & Park Central Dr. - Signalized5. Parham Road & Magellan Pkwy. - Unsignalized
1. I-95 & Parham Road Interchange:
a. I-95 SB (approximately MM 84.1)b. I-95 SB off rampc. I-95 SB off ramp loopd. I-95 SB on rampe. I-95 SB on ramp loopf. I-95 NB off rampg. I-95 NB off ramp looph. I-95 NB on rampi. I-95 NB on ramp loopj. Parham Road EB – between I-95 SB on ramp and I-95 SB off ramp loopk. Parham Road WB – between I-95 NB on ramp and I-95 NB off ramp loop2. I-95 & Rte. 301 (Chamberlayne Rd.) Interchange:
a. I-95 SB (approximately MM 82.5)b. I-95 SB off rampc. I-95 SB on rampd. I-95 NB (approximately MM 81.3)e. I-95 NB off rampf. I-95 NB on ramp from SB 301g. I-95 NB on ramph. Rte. 301 U-turn curvei. Rte. 301 SBj. Rte. 301 NB
3. I-95 & I-295 Interchange:
a. I-95 SB (approximately MM 84.7)b. I-95 SB off rampc. I-95 SB on rampd. I-95 SB on ramp loope. I-95 NB (approximately MM 83.6)f. I -95 NB off rampg. I-95 NB off ramp looph. I-95 NB on ramp loopi. I-95 NB (approximately MM 43)j. I-295 NB (through)k. I-295 NB (Exit 43 B, C, D)l. I-295 NB – between I-95 SB off ramp and I-295 NB off ramp (Rte. 1 interchange)m. I-295 SB – between I-295 SB on ramp (Rte. 1 interchange) and I-95 SB on rampn. I-295 SB (approximately MM 42.9)
1. I-295 & US Rte. 1 Interchange:
a. I-295 SB off rampb. I-295 SB off ramp loopc. I-295 SB on rampd. I-295 SB on ramp loope. I-295 NB off rampf. I-295 NB off ramp loopg. I-295 NB on ramph. I-295 NB on ramp loopi. I-295 SB (through)j. I-295 SB (Exit 43 D, C, B, A)k. US Rte. 1 NBl. US Rte. 1 SB

Traffic Forecasting
JMT will use existing count data, VDOT historic traffic count data, and RRTPO Regional Travel Demand Model (TDM) to develop traffic growth rates. JMT will use the growth rates and traffic data information available on VDOT Pathways for Planning (P4P) website: https://vdotp4p.com/analyze/traffic-forecast-analysis. The growth rates from P4P will be used to verify the traffic growth projections. The forecasted traffic volumes will be submitted to the SWG for review prior to any analysis being performed. VDOT and Henrico County will provide information related to known potential developments impacting traffic within the study area. JMT will review the TDM to determine if the known developments are captured in the regional model. At the time of this framework document development, VDOT informed JMT that the GreenCity development and planned Magellan Parkway Extension are not included in the 2045 TDM; but during the kickoff meeting RRTPO informed the SWG that the 2050 model is being developed and includes GreenCity development and Part of Magellan Parkway Extension, accordingly, JMT will update the model to include these two developments, if needed. Also, VDOT and the County shared that Scotts Road Bridge over I-95 will be demolished and there is a plan by the County to build a pedestrian bridge in generally the same location.
Safety Review and Analysis
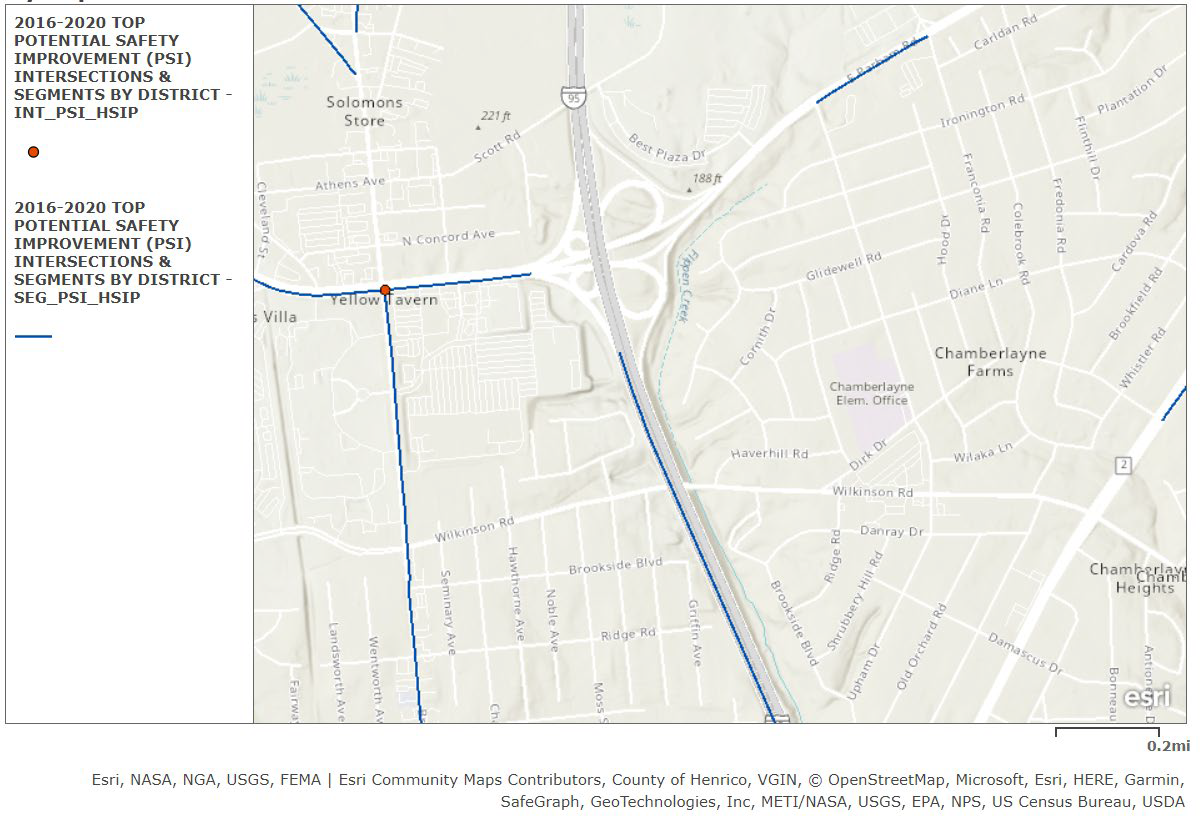
Within the study area, I-95 and Parham Road contain ranked segments of potential for safety improvements (PSI) within the Richmond District based on 2016-2020 and 2017-2021 crash databases. Additionally, Parham Road contains PSI intersections. The PSI list identifies segments or intersections that have experienced more crashes than what is predicted for that site based on safety performance functions and ranks those sites based on that differential. Note that PSI ranks for segments and intersections were obtained from the 2016-2020 and the 2017-2021 PSI databases, since the latter only includes VDOT maintained segments and intersections. The PSI locations will serve to help prioritize where to focus safety improvements because they have the highest potential to improve safety; however, a detailed safety analysis will be conducted within the entire study area using five-year historical crash data, downloaded from VDOT’s PowerBI crash database, to compare to the PSI rankings and identify hot spots, contributing factors, and countermeasures to address and prioritize safety needs. The historical intersection crash analysis results will be compared with the PSI ranked intersections as the PSI rank indicates a higher prioritization. Figure 3 and Figure 4 summarize the PSI segments within the study area which include the following segment and intersections:
- Parham Road from Route 1 to I-95 interchange (Rank 22) – Source 2017-2021 database
- Parham Road from St. Charles Road to Franconia Road (Rank 616) – Source 2016-2020 database
- Parham Road at Route 1 (Rank 26) – Source 2017-2021 database


VDOT Pedestrian Safety Action Plan (PSAP) segments within the study area are shown in Figure 5 and Figure 6, Source: Pedestrian Safety Action Plan (PSAP) 3.0 database and include:
• East Parham Road from Best Plaza Drive to East of Magellan Parkway (District Top 5% Corridors)

Figure 5: PSAP Segments/Intersections Summary Map (Statewide)

Figure 6: PSAP Segments/Intersections Summary Map (District)
JMT will conduct a review of the most recent five years of available crash data, assumed to be 2018-2022. The crash review will include the development of intersection crash summaries and the identification of crash patterns. JMT will review pedestrian crashes to determine what proportion of crashes are related to pedestrians and bicyclists along Parham Road. Density heat maps along I-95 will also be created to visualize the crash patterns within the study area.
Study Schedule
| Item | Estimated Completion |
|
Data Collection |
Completed |
|
First Public Outreach |
October 2023 |
|
Existing condition memorandum and presenting to SWG |
October 2023 |
|
Travel Demand Forecasting |
October 2023 |
|
Stage 1 – iCAP Analysis and Alternative Screening |
November 2023 |
|
Stage 1 – Concept Development and Cost Estimate |
December 2023 |
|
Stage 2 – Alternative Analyses (Opening and Design Year) * |
January 2024 |
|
Second Public Outreach |
February 2024 |
|
Stage 2 – Concept and Detailed Cost Estimate for Preferred Alternative |
March 2024 |
|
Draft Report |
July 2024 |
| Final Report | December 2024 |


